Data integration: the process of bringing together data from disparate sources in a unified view to create a dataset with both valuable and usable information.
After completing this lesson, you’ll be able to:
Safe Software began in 1993, helping forestry companies exchange maps with the provincial government. It was technically possible to share the maps back then, but only after hours of manual work. Often, an incredible amount of information was lost in the process.
Nobody was happy. Safe Software created FME to address this problem and has been solving data challenges ever since.
FME (aka. Feature Manipulation Engine) is a data integration platform with the best support for spatial data worldwide. FME allows you to easily address the question of “where” and convert data precisely for your needs. You can author custom workflows that improve access to data and solve compatibility issues without needing to code anything.
You will learn the FME essentials throughout this learning path by completing hands-on problem-solving exercises. You will learn how FME helps you integrate data through three phases:
By the end of the learning path, you will be ready to create your own FME data integration workflows.
Data integration helps address the following challenges faced by many organizations:
Data silo: data or databases that are maintained and used outside organization-wide data administration. Often they are associated with a single individual or department.
The City of Coquitlam uses FME to break down data silos across a number of departments and systems, including:
Removing data silos through data integration can:
To many, 'spatial data' translates directly to 'map.' Maps are certainly a great way to display spatial data, but there is much more spatial data is good for. After all, everything we see and do has some spatial component. Where we live, how we travel - the list doesn’t end.
We can learn more about why certain spatial relationships exist by analyzing spatial data and how certain variables impact our lives. Why are certain locations popular travel destinations? Why does a brand succeed in one country and not another? It’s time to start adopting spatial and location data practices to better understand human behavior and our influence on the planet.
More and more organizations are producing and using spatial data. However, getting value out of that data through automating business processes and analyzing spatial patterns requires spatial data integration. Many data integration platforms exist, but FME provides the best support for spatial data integration.
Spatial data can be stored in vector or raster formats. Vector spatial data is made up of points, lines, and polygons. At its core, it consists of lists of coordinates on a plane and information regarding how they are connected.
Raster data is made up of pixels, where the value (or color) of a pixel represents the value of a phenomenon, e.g., the average annual precipitation. Standard imagery uses the visible spectrum like a regular photograph. However, other kinds of imagery are available. For example, imagery in the near-infrared band can be used to measure the prevalence of vegetation beyond what the human eye can detect.
Raster data is better for representing continuous data that varies over an entire area, such as elevation. Vector data is better for representing discrete objects, such as the outlines of buildings (polygons).
| Geometry type | Illustration | Examples |
| Point |  |
Cell towers Community centers Fire hydrants Oil wells |
| Line |  |
Electricity distribution network Pipelines Roads Trails Water distribution network |
| Polygon |  |
Administrative borders Building footprints Service areas Water bodies Zoning districts |
| Raster |  |
Classified land use Elevation Orthophoto (a satellite or aerial photograph adjusted so the scale is uniform) Scanned documents |
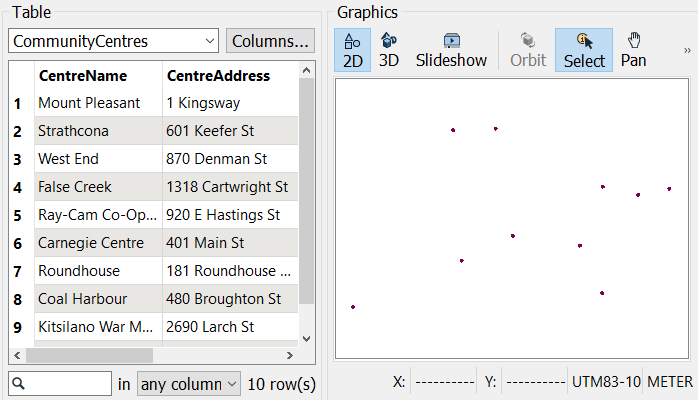
Spatial data contains geometry data that describes the actual location of the data. It also usually includes attribute data that describes the features. For example, here is a dataset of point locations of community centers that includes attributes such as “CentreName” and “CentreAddress.”
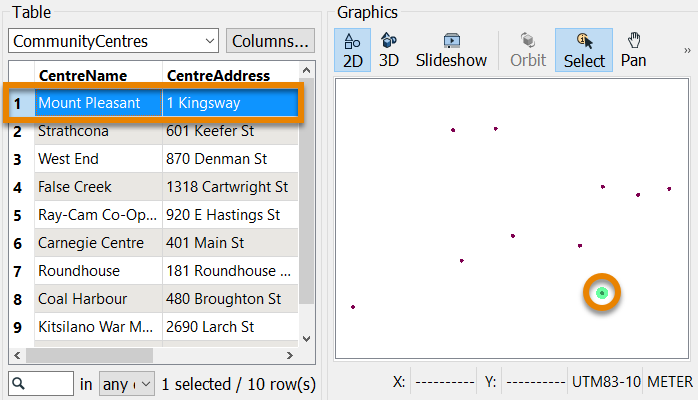
Having geometry and attributes in the same dataset lets you query or filter the data. For example, you could filter the dataset of community centers to select the point with a “CentreName” that equals “Mount Pleasant.”
By itself, spatial data can be used to create maps or analyzed to identify patterns such as clusters. However, it must be integrated with other data sources to gain maximum value. For example, retail businesses integrate existing store locations, road networks, and neighborhood demographic data to identify the best place to build new stores.
Integrating spatial with nonspatial data, such as spreadsheets or database tables, is also possible. This integration is possible as long as the nonspatial data has an attribute that holds some spatial information. Many nonspatial datasets contain addresses, coordinates, or other identifiers. Combining these with spatial data allows you to unlock new insights. For example, retail businesses combine customer transaction data (containing their zip or postal code) with neighborhood demographic data to understand their customers and market their products or services more effectively.
After completing this lesson, you’ll be able to:
Safe Software began in 1993, helping forestry companies exchange maps with the provincial government. It was technically possible to share the maps back then, but only after hours of manual work. Often, an incredible amount of information was lost in the process.
Nobody was happy. Safe Software created FME to address this problem and has been solving data challenges ever since.
FME (aka. Feature Manipulation Engine) is a data integration platform with the best support for spatial data worldwide. FME allows you to easily address the question of “where” and convert data precisely for your needs. You can author custom workflows that improve access to data and solve compatibility issues without needing to code anything.
You will learn the FME essentials throughout this learning path by completing hands-on problem-solving exercises. You will learn how FME helps you integrate data through three phases:
By the end of the learning path, you will be ready to create your own FME data integration workflows.
Data integration helps address the following challenges faced by many organizations:
Data silo: data or databases that are maintained and used outside organization-wide data administration. Often they are associated with a single individual or department.
The City of Coquitlam uses FME to break down data silos across a number of departments and systems, including:
Removing data silos through data integration can:
To many, 'spatial data' translates directly to 'map.' Maps are certainly a great way to display spatial data, but there is much more spatial data is good for. After all, everything we see and do has some spatial component. Where we live, how we travel - the list doesn’t end.
We can learn more about why certain spatial relationships exist by analyzing spatial data and how certain variables impact our lives. Why are certain locations popular travel destinations? Why does a brand succeed in one country and not another? It’s time to start adopting spatial and location data practices to better understand human behavior and our influence on the planet.
More and more organizations are producing and using spatial data. However, getting value out of that data through automating business processes and analyzing spatial patterns requires spatial data integration. Many data integration platforms exist, but FME provides the best support for spatial data integration.
Spatial data can be stored in vector or raster formats. Vector spatial data is made up of points, lines, and polygons. At its core, it consists of lists of coordinates on a plane and information regarding how they are connected.
Raster data is made up of pixels, where the value (or color) of a pixel represents the value of a phenomenon, e.g., the average annual precipitation. Standard imagery uses the visible spectrum like a regular photograph. However, other kinds of imagery are available. For example, imagery in the near-infrared band can be used to measure the prevalence of vegetation beyond what the human eye can detect.
Raster data is better for representing continuous data that varies over an entire area, such as elevation. Vector data is better for representing discrete objects, such as the outlines of buildings (polygons).
| Geometry type | Illustration | Examples |
| Point | |
Cell towers Community centers Fire hydrants Oil wells |
| Line | |
Electricity distribution network Pipelines Roads Trails Water distribution network |
| Polygon | |
Administrative borders Building footprints Service areas Water bodies Zoning districts |
| Raster | |
Classified land use Elevation Orthophoto (a satellite or aerial photograph adjusted so the scale is uniform) Scanned documents |
Spatial data contains geometry data that describes the actual location of the data. It also usually includes attribute data that describes the features. For example, here is a dataset of point locations of community centers that includes attributes such as “CentreName” and “CentreAddress.”
Having geometry and attributes in the same dataset lets you query or filter the data. For example, you could filter the dataset of community centers to select the point with a “CentreName” that equals “Mount Pleasant.”
By itself, spatial data can be used to create maps or analyzed to identify patterns such as clusters. However, it must be integrated with other data sources to gain maximum value. For example, retail businesses integrate existing store locations, road networks, and neighborhood demographic data to identify the best place to build new stores.
Integrating spatial with nonspatial data, such as spreadsheets or database tables, is also possible. This integration is possible as long as the nonspatial data has an attribute that holds some spatial information. Many nonspatial datasets contain addresses, coordinates, or other identifiers. Combining these with spatial data allows you to unlock new insights. For example, retail businesses combine customer transaction data (containing their zip or postal code) with neighborhood demographic data to understand their customers and market their products or services more effectively.
